(Study Material) RRB NTPC (Tier -2) Exam (Numerical Aptitude) - Bar Charts
(Study Material) RRB NTPC (Tier -2) Exam (Numerical Aptitude) - Bar Charts
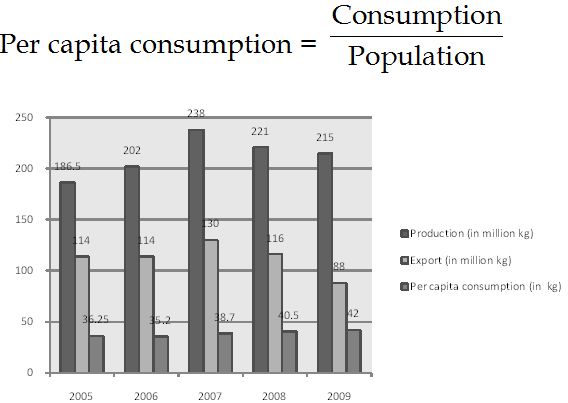
Directions: The following bar graph gives the production, exports and per capita consumption of rice in country X from 2005 to 2009.
Consumption = Production – Exports
Mazor buyer countries of Indian gold as % of gold exports from India.
1. In which year was the percentage increase in the consumption of rice over previous year the highest?
(a) 2006
(b) 2007
(c) 2008
(d) 2009
2. What was the population of country X in the year 2007 (in millions)
(a) 2.64 millions
(b) 2.72 millions
(c) 2.79 million
(d) None of these
3. The ratio of exports to consumption in the given period was the highest in the year.
(a) 2005
(b) 2006
(c) 2007
(d) 2008
4. In which of the given years the population of country X the highest?
(a) 2006
(b) 2007
(c) 2008
(d) 2009
5. In how many of the given years was the consumption of trice more than 45% of the production?
(a) 1
(b) 2
(c) 4
(d) 3
Buy Printed Study Kit for Railway Recruitment Board (RRB) "Tier -2" Exam
रेलवे भर्ती बोर्ड (आरआरबी) परीक्षा (टीयर -2) के लिए अध्ययन सामग्री
Buy Postal Test Series Programme For RRB Tier -2 Exam (English Medium)
<<Go Back To Main Page
NEW! RRB NTPC EXAM STUDY NOTES - PDF COPY
NEW! RRB NTPC EXAM CBT Online Test Series - With FREE DEMO Test
RRB NOTES EBOOKS
|
RRB NTPC EXAM PDF |
|
|
(e-Book) RRB NTPC CBT-1 2021 Exam Papers with Answers [English Medium] |
|
