Employment Statistics Indian Railways
Employment Statistics Indian Railways

| Year | Railway Zones/Units/Board and Other Offices - Central | Railway Zones/Units/Board and Other Offices - Eastern | Railway Zones/Units/Board and Other Offices - East - Central | Railway Zones/Units/Board and Other Offices - East - Cost | Railway Zones/Units/Board and Other Offices - Metro Railway - Kolkata | Railway Zones/Units/Board and Other Offices - Northern | Grand Total |
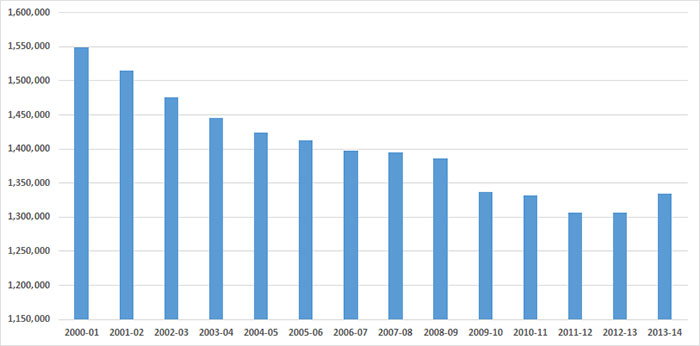
| 2000-01 | 213,199 | 208,237 | NA | NA | NA | 242,747 | 1,549,385 |
| 2001-02 | 208,024 | 204,376 | NA | NA | NA | 236,973 | 1,514,816 |
| 2002-03 | 204,707 | 195,932 | NA | NA | NA | 231,923 | 1,475,884 |
| 2003-04 | 126,813 | 133,613 | 92,165 | 43,985 | NA | 164,304 | 1,445,428 |
| 2004-05 | 124,757 | 131,513 | 84,180 | 44,450 | NA | 161,906 | 1,424,389 |
| 2005-06 | 122,783 | 129,900 | 8,252 | 44,920 | NA | 160,332 | 1,412,434 |
| 2006-07 | 121,734 | 129,102 | 83,812 | 45,510 | NA | 158,378 | 1,397,610 |
| 2007-08 | 119,396 | 130,322 | 83,122 | 46,115 | NA | 157,021 | 1,394,418 |
| 2008-09 | 119,574 | 126,747 | 81,408 | 43,430 | NA | 160,215 | 1,386,123 |
| 2009-10 | 115,034 | 121,477 | 77,669 | 41,294 | NA | 155,527 | 1,337,533 |
| 2010-11 | 113,341 | 120,421 | 74,928 | 41,526 | 3,809 | 156,320 | 1,332,204 |
| 2011-12 | 110,022 | 117,711 | 72,765 | 41,219 | 4,094 | 153,523 | 1,306,210 |
| 2012-13 | 111,274 | 117,362 | 77,088 | 42,893 | 3,763 | 149,016 | 1,307,253 |
| 2013-14 | 109,226 | 120,372 | 81,440 | 44,969 | 3,853 | 155,373 | 1,334,115 |
Click Here to Download Full PDF
Courtesy: RRB
